Keeping Medical Expenditures Aligned with Fiscal Realities
November 18, 2021
R-2021-008E
Budget watchers in Japan’s Ministry of Finance are targeting certain high-end medical devices in an effort to curb healthcare spending. Using empirical data, public economics expert Kazumasa Oguro challenges the assumptions behind their recommendations.
* * *
Medicine has progressed by leaps and bounds in recent years, thanks in large part to rapid advances in digital medical technology. Private industry has led the way in the development of a host of innovative medical devices that hold the key to the digital transformation of healthcare.
A landmark in this transformative process was the listing of the software application Join—which allows data from digital imaging systems to be shared and viewed on mobile terminals—as a medical device covered by Japan’s public health insurance scheme. That was back in 2016, and since then digital transformation has opened up new possibilities for telemedicine, as well as advances in prevention, diagnosis, and treatment that could lead to significant improvements in people’s health.
But the rapid pace of innovation in medical devices also creates challenges for Japan’s public health insurance system. To be adopted by clinics and hospitals, each new device must secure regulatory approval and then be listed and priced for reimbursement. Since there are limits to the system’s financial resources, how can expenditures be kept down without stunting innovation?
Japan, as we know, labors under a towering public debt, and healthcare costs continue to skyrocket as the nation’s aged population grows even older. With pressure mounting to curtail the growth in healthcare expenditures (accounting for roughly a third of the ¥120 trillion in total social security costs), the Council on Economic and Fiscal Policy and the Ministry of Finance have stressed the need for a more efficient allocation of healthcare resources, with a particular focus on such high-end equipment as CT (computed tomography) scanners and MRI (magnetic resonance imaging) machines.
In a November 2018 report issued by the Finance Ministry’s Fiscal System Council, the following arguments were adduced in support of new regulations restricting the purchase of high-end medical equipment, particularly CT and MRI scanners.
• The government already has mechanisms for regulating the geographical allocation of hospital beds for efficient delivery of healthcare nationwide, but it has no comparable mechanisms for controlling the allocation of other medical resources, including costly medical equipment. There is a need for such mechanisms, both to correct regional disparities and to curtail the growth of healthcare expenditures.
• The fiscal year 2018 budget execution survey by the Ministry of Finance found a 3-to-1 disparity between prefectures in the number of CT scanners and MRI machines deployed per 100,000 population. The survey also found that every one of Japan’s prefectures had more CT scanners per 100,000 than any OECD country other than Japan, and only the United States boasted more MRI systems. Usage per device tended to be lower in prefectures with a higher per capita concentration of devices. The inference is that medical facilities in these areas may be overinvesting in such equipment relative to demand, contributing to the financial challenges facing rural healthcare systems. From the standpoint of efficient utilization of high-cost medical equipment, efforts should be made to optimize its geographical allocation through screening and regulation of new purchases and upgrades (in consultation with local healthcare authorities, hospitals, and so forth), taking into account local demand as well as the impact on public healthcare expenditures and the finances of local healthcare institutions.
At present, the costs incurred by high-end medical equipment are smaller than the roughly ¥10 trillion drug market, but the government’s policymakers are anticipating a sharp increase in medical-device expenditures as a percentage of gross domestic product; hence the focus on this aspect of healthcare spending.
Ideally, such assumptions should be based on hard data, including historical trends in medical-device spending as a percentage of GDP. Unfortunately, there is no accurate information on the costs incurred by medical devices. As a substitute, I estimated the size of the medical device market in Japan over time using production, import, and export data published by the Ministry of Health, Labor, and Welfare in its Annual Report of Statistics of Production by Pharmaceutical Industry.
Based on these estimates, I found an almost continuous increase in the size of the market as a percentage of GDP, from 0.37% in 2001 to 0.52% in 2018. That represents a rise of 0.15 percentage points over 17 years, or an average increase of 0.009 points per year—a rate slightly exceeding Japan’s nominal GDP growth over the same period. This suggest that the overall cost burden of medical devices on the healthcare system are growing.
However, a more detailed breakdown and analysis of data is needed to determine the source of that growth. Fortunately, the market data on medical devices in the aforementioned Statistics of Production is broken down by product category and subcategory. Using this data, I was able to estimate market growth in each of three broad areas: diagnostic, therapeutic, and “other” medical devices. Diagnostic devices comprise the categories of diagnostic imaging systems (including CT and MRI scanners), devices and tools for diagnostic X-ray equipment, biophenomena measuring and monitoring systems, in vitro clinical test equipment, and clinical equipment. Therapeutic devices consist of operating equipment and supplies, artificial organs and organ assist devices, therapeutic and surgical devices, and steel products for medical use. “Other” devices encompass the categories of dental equipment, dental materials, ophthalmic products, surgical dressings and hygienic products, and medical devices for home use.
Figure 1. Trends in the Japanese Market for Medical Devices, 2008–2018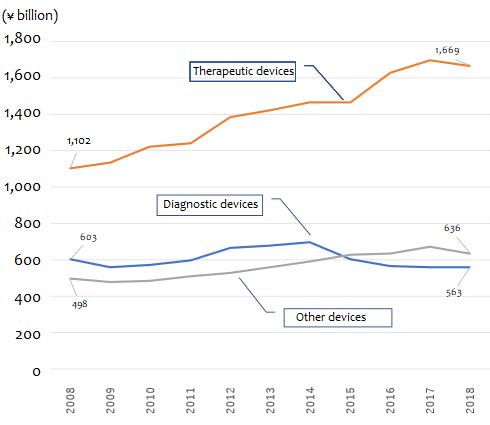
Source: Based on data from the Ministry of Health, Labor, and Welfare, Statistics of Production by Pharmaceutical Industry.
As the figure suggests, therapeutic equipment accounts for most of the growth in the medical device market. The market for therapeutic medical devices grew from about ¥1.10 trillion to around ¥1.67 trillion in the decade between 2008 and 2018, expanding at a rate of around ¥56.6 billion a year on average. “Other” devices rose from ¥494.7 billion to ¥636.3 billion over the same decade, an average annual increase of close to ¥14 billion. During the same decade, the market for diagnostic devices (including CT and MRI scanners) shrank by more than ¥40 billion, dropping from ¥603.3 billion to ¥562.6 billion.
Breaking these trends down further, we find that the fastest market growth has been in the categories of “operating equipment and supplies” and “artificial organs and organ assist devices,” both in the area of therapeutic medical devices. The market for operating equipment and supplies almost doubled in 10 years, from ¥449.3 billion in 2008 to ¥848.1 billion in 2018, rising at a rate of almost ¥40 billion a year. Artificial organs and organ assist devices have swollen from ¥518.7 billion to ¥619.9 billion, an average annual increase of over ¥10 billion. During the same period, the growth in diagnostic imaging systems, including CT and MRI scanners, has been modest—from ¥259.5 billion to ¥263.1 billion, an increase of just ¥3.6 billion over the course of a decade.
Table 1. Growth in the Japanese Market for Medical Devices by Type
(¥ billion) 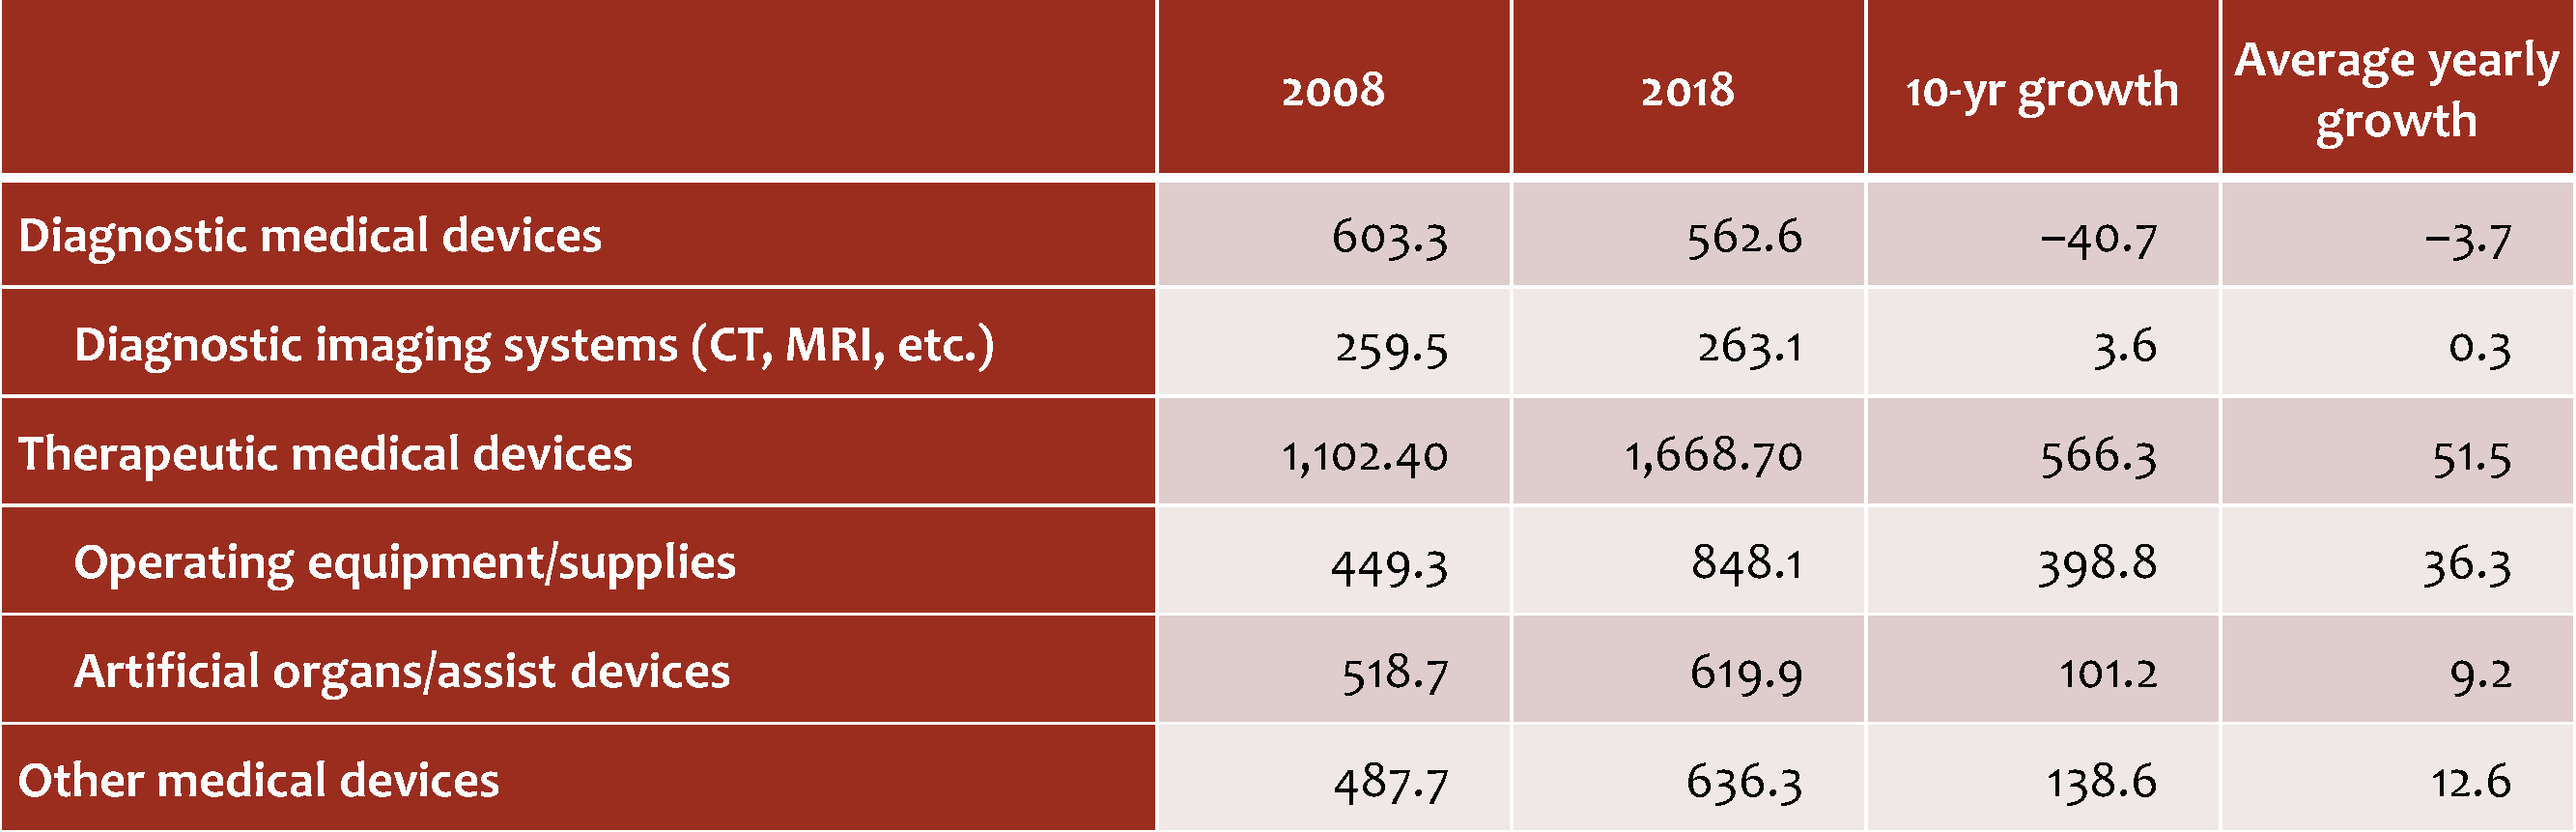
Source: Based on data from the Ministry of Health, Labor, and Welfare, Statistics of Production by Pharmaceutical Industry.
For a still more fine-grained analysis, I consulted the data in the Statistics of Production for each subcategory of medical device and grouped the subcategories by current market size and annual rate of growth, as follows:
Group 1: At least ¥5 billion and growing by 1% or more per year (72 subcategories)
Group 2: At least ¥5 billion and growing by less than 1% per year (31 subcategories)
Group 3: Less than ¥5 billion and growing by 1% or more per year (150 subcategories)
Group 4: Less than ¥5 billion and growing by less than 1% per year (71 subcategories)
The reason I chose 1% as a benchmark is that the government’s latest Economic and Fiscal Projections for Medium to Long Term Analysis (issued July 21, 2021) forecasts a nominal GDP growth rate of roughly 1% between now and 2030. Products in Group 1, of which I found 72, are thus the most problematic from a fiscal standpoint, while products in Group 4 are the least worrying.
While CT and MRI scanners have been lumped together by policymakers intent on slowing the growth in healthcare expenditures, my analysis suggests that their impact is quite different. The market for CT scanners is worth ¥44.9 billion, but it is shrinking at an annual rate of 1.1%, which places it in Group 2. MRI scanners, on the other hand, belong to Group 1, and its market of ¥34.9 billion has been growing at an annual rate of 3.6%.
As noted above, there are more than 70 subcategories other than MRIs that fall into Group 1. In Table 2, I have listed the top 20 in terms of market size. Of these large and growing subcategories, there are three that top ¥100 billion annually: sterile tubes and catheters for blood vessels; other contact lenses; and artificial joints, bones, and related devices. Next down, valued at between ¥50 billion and ¥100 billion, are operating equipment and supplies not elsewhere classified; dental gold-silver-palladium alloys; sensory aids; and stents.
Table 2. Medical Device Subcategories in Group 1 (market valued at ¥5 billion and growing at a rate of 1% or more)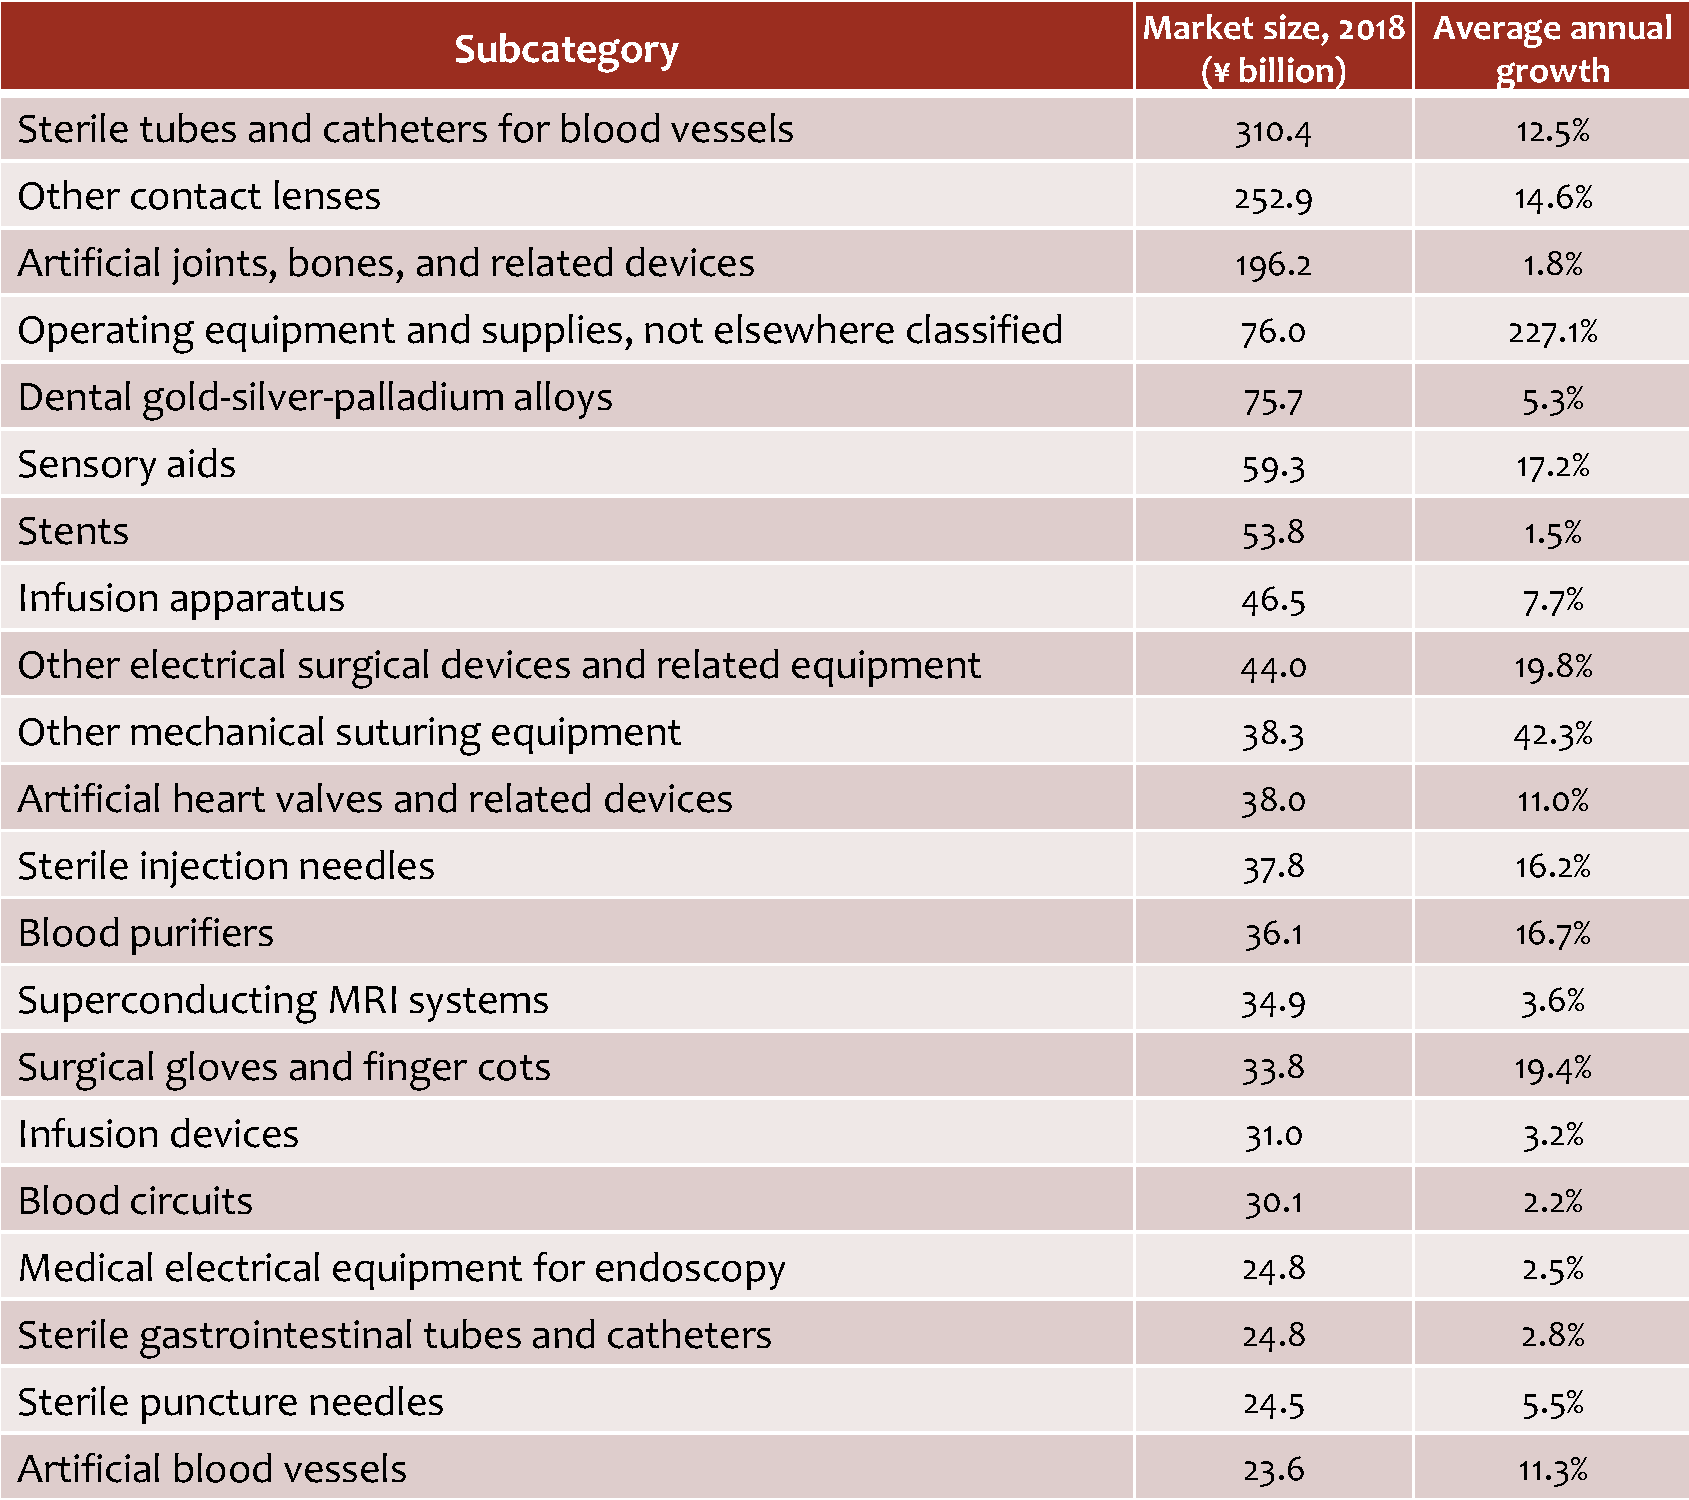
Source: Based on data from the Ministry of Health, Labor, and Welfare, Statistics of Production by Pharmaceutical Industry.
I am not suggesting that the healthcare system should take immediate steps to reduce spending on such devices. My point is simply that budget cutters in the Ministry of Finance appear to have targeted CT and MRI scanners rather arbitrarily, without conducting detailed analyses to gauge the growth in medical-device costs as a percentage of GDP or the relative contribution of different subcategories to Japan’s healthcare costs. Any reform of the health insurance system should be undertaken on the basis of such fine-grained analysis.
Additionally, budget hawks need to keep sight of the public-investment aspect of healthcare instead of focusing solely on cost. In addition to saving lives, innovative medical technologies have the potential to create new markets and new jobs, contributing to economic growth and augmenting tax revenues. In attempting to balance budgetary concerns against the need to encourage medical innovation, we should strive to develop mechanisms for reallocating our finite resources with a view to optimum return on investment, drawing on the kind of analysis presented here.
-
-

- RESEARCH DIRECTOR
- Kazumasa Oguro
- Kazumasa Oguro
- Areas of Expertise
-
- Public finance
- social security
- public economics
- generational gap
- population problems
- Research Program
-

Featured Content
-
Funding the Policies to Boost Japan’s Birthrate
Funding the Policies to Boost Japan’s Birthrate
-
Agar
Agar
-
CSR in Japan: Unique Features and Recent Trends
CSR in Japan: Unique Features and Recent Trends
-
How Will the Economic Security Law Change Japan’s Sci-Tech Policy?
How Will the Economic Security Law Change Japan’s Sci-Tech Policy?
-
Japanese Honeybee
Japanese Honeybee